
Contribute visualisation

Yu Liang Weng
21 July 2021 · 12 min read
Thank you for considering contributing visualisations to Dataviz.Shef! We are committed to open research so there are a couple of things to bear in mind before you proceed:
- Are you willing to make your code open sourced for the visualisation?
- Are other people able to access the data?
- Are you willing to include some simple guidance on how to reproduce the visualisation?
- Are your resources licensed?
If you could answer yes to most of the questions above, please go to the next section.
The setup process is identical to the one in contributing blog post. You will need to install git and Nodejs, and have a GitHub account in order to preview and submit your visualisation. Once you've set up, open git bash and run gatsby develop in the base directory. Now you can view the site at http://localhost:8000/. The website will be reloaded automatically on changes. Press Ctrl + C (Command + C on macOS) if you want to stop the server running locally. Your visualisation item page will be located at http://localhost:8000.
Alternatively, skip the setup and follow the steps below if you do not wish to use command line tools. The difference is that you would not be able to preview the page and would have to upload files manually on GitHub.
Go to the directory dataviz-hub2/content/visualisation and create a new folder with a name of the format YYYY-MM-DD-this-is-my-title. The folder name will be used when creating the page url. Within this new folder, add all required files to display your visualisation such as thumbnail and javascript files. Then create a new text file and name it index.mdx.
If you haven't set up, create a new folder anywhere in your machine and follow the steps.
MDX is a variant of the MD format that allows us to write JSX in markdown files. This website uses MDX to provide interactive experience to users while preserving the benefit of using markdown. This is an example of the file:
---
frontmatter...
---

visualisation code...

<VisPagination mdx="{props.mdx}"> ... </VisPagination>

<VisDetail mdx="{props.mdx}" />

export const dataArray = [ ... ]

<VisDiv>
  <Tab data="{dataArray}" />
</VisDiv>
Let's dive in to see how each component works.
Frontmatter is the first section you will need to define in the index.mdx file. This section is used to specify important properties for the visualisation.
An example of the frontmatter (make sure you also include ---):
---
type: visualisation
author: [Author One, Author Two]
title: My title for the visualisation
thumbnail: ./thumb.png
category: [Library]
tag: [Contribute, Visualisation, Example]
description: This is my description for the visualisation.
date: 2021-06-24
pngImagePath: relative-local-path.png
svgImagePath: image/relative-local-path.svg
svgExternalImagePath: https://example.org/image.svg
pngExternalImagePath: https://example.org/image.png
rowSpan: 2
columnSpan: 2
---
The following table listed all properties you can specify:
| Property | Required | Description |
|---|---|---|
| type | Y | This must be entered as visualisation. |
| author | Y | Use squared bracket if there are more than one author. |
| title | Y | Title for your visualisation. |
| thumbnail | Recommend | Local path (in your directory) for your thumbnail. This will be displayed on visualisation pages. |
| category | Y | Categories for your visualisation, usually the name of your faculty/department. |
| tag | Y | Tag for your visualisation. |
| description | Recommend | A good description help people better understand your visualisation. |
| date | Y | Format: YYYY-MM-DD |
| template | Set it to "custom" if you want to customise the style of the page | |
| pngImagePath | Local path (in your directory) of the visualisation in PNG format. | |
| svgImagePath | Local path (in your directory) of the visualisation in SVG format. | |
| svgExternalImagePath | External path (url) of the visualisation in SVG format. | |
| pngExternalImagePath | External path (url) of the visualisation in PNG format. | |
| rowSpan | Default: 1. The number of rows this visualisation will occupy on visualisation pages. | |
| columnSpan | Default: 1. Max: 4. Similar to rowSpan but in column-wise. | |
| featured | Set it to true if this is a featured visualisation. | |
| d3 | Path of D3 documents to include. See contribute blog posts for more information. | |
| published | If the visualisation is not ready in production yet, set this to true |
If this is the first time you contributing something to the website, it is necessary to add your name and avatar to the file author.json located at dataviz-hub2/src/data, otherwise author info will not be shown on the page (and the website will produce errors). Format:
...
},  // Make sure you've added comma after the previous right curly bracket
{   // Start with left curly bracket
  "name": "New Author",
  // The exact same name you've put in the mdx file, use the same name for all mdx files you created
  "avatar": "../images/author/default.jpg",
  // If you want to add your own avatar, place it under the /src/images/author folder and replace "default.jpg" with your image name
} // No comma
Regardless of the type of visualisation (except iframe) you are adding, remember to set id="visualisation" on the parent element of the visualisation, this allows the website to capture your visualisation as images. If what you have created does not fall into the types listed here, please get in touch to discuss options.
If you want to add an image, you can use the following code:
<VisDiv>
  <img id="visualisation" src="https://example.com/url.png" alt="Description of
  your visualisation" style={{borderRadius: '20px'}} />
</VisDiv>
The <VisDiv> tag has a default maximum width of 550px and will centre anything inside it. To change the maximum width, add
style={{maxWidth: 'px'}}to VisDiv with the desired width before px.
See contribute blog posts for more information. The general principle is to create a SVG element with specified id (for example, visualisation) in the index.mdx file, then add elements to the SVG element in a separate file.
You have created visualisations using a React visualisation package? That's great! You can wrap the visualisation in a React component then import it in the index.mdx file. This process can be break down into the following steps:
- Install the package using
npm install package-name. - Create a react component that includes your visualisation in a separate file called
visualisation.jsx(any name will do). Don't forget to setid="visualisation"on the component. - Import the visualisation in
index.mdx.
An example visualisation of this use case is - Increased snack intake in UK and Australia.
If you have created any interactive web applications or javascript visualisations that is hosted on other website, you can embed them using <iframe>:
<iframe
  width="100%"
  height="700px"
  src="https://ylwshef.shinyapps.io/Which-Politicians-Receive-Abuse/"
/>
The next step is to add pagination and utility buttons for your visualisation. All you need is one line code as shown below:
---
frontmatter
---

<VisDiv> visualisation code </VisDiv>

<VisPagination mdx="{props.mdx}" />
The mdx={props.mdx} ensures the details of the current page are passed to the VisPagination component. Make sure code for visualisation always comes before other elements in the index.mdx file.
Every visualisation item page contains an 'embed code' button which allows visitors to copy the code snippet and embed the visualisation elsewhere. It would be really helpful if you could add extra details to make this possible.
To make embed code available, we need to make some changes to the pagination component. In here we open the Vispagination tag and insert the EmbedCode tag:
<VisPagination mdx="{props.mdx}">
  <EmbedCode />
</VisPagination>
If you want people to embed the image in the current directory, pass one of image properties in the frontmatter to the EmbedCode like this:
<EmbedCode localPath="svgExternalImagePath" />

# options: # svgExternalImagePath | svgImagePath # pngExternalImagePath |
pngImagePath
If the image is elsewhere and is not included in any of the image properties, use the url attribute:
<EmbedCode url="https://example.com/my-image.svg" />Then this component will convert to something like the following:
<a href="https://dataviz-shef.ac.uk/my-url" target="_blank">
  <img
    alt="visualisation title"
    src="https://example.com/my-image.svg"
    style="height: 550px; width:auto"
  />
</a>
If your visualisation is an interactive web application or a component hosted elsewhere, we can use iframe to embed another HTML document. In this case, we need to pass "iframe" to the type attribute:
<EmbedCode url="https://example.com/some-page" type="iframe" />The final output:
<a href="https://dataviz-shef.ac.uk/my-url" target="_blank">
  <iframe width="100%" height="550px" src="https://example.com/some-page" />
</a>
In both types we have an addition attribute height (default: 550px) can specify, which determine the height of embedded element:
<EmbedCode url="https://example.com/some-page" type="iframe" height="700px" />
If you want to customise the output seen by visitors, insert your code snippet in between the EmbedCode tag and pass true to the custom attribute:
<EmbedCode custom="{true}">
  <a href="https://dataviz.shef.ac.uk/page-url">
    <img
      src="https://link-to-vis.com/some-image.svg"
      style="width: 100%, height: 600px; border-radius: 20px"
      alt="This is my visualisation"
    />
  </a>
</EmbedCode>
Note that any other attributes passed to the EmbedCode do not have any effects if custom is set to true.
In the item page we can display several information (description, author details, tags, categories) about the visualisation using the VisDetail tag:
...

<VisPagination mdx="{props.mdx}"> ... </VisPagination>

<VisDetail mdx="{props.mdx}" />
if you wish to not display certain information, consider using the following attributes and pass false to them:
# default: true # Tags and categories are grouped into displayTag
<VisDetail
  mdx="{props.mdx}"
  displayDescription="{true}"
  displayAuthor="{false}"
  displayTag="{false}"
/>
This community encourages an open research culture and adheres to the FAIR (findable, accessible, interoperable, reusable) principle. Therefore, it would be wonderful if you could include as many details about the visualisation as possible. You can choose to use the visualisation tab component, or simply write information in plain text.
We have prepared a tab component for you to organise information for the visualisation, but of course this is non-compulsory.
The tab component receives an array of data objects and maps each data object to a tab. The first step is to create a data array like the following in the index.mdx file:
export const dataArray = [
{
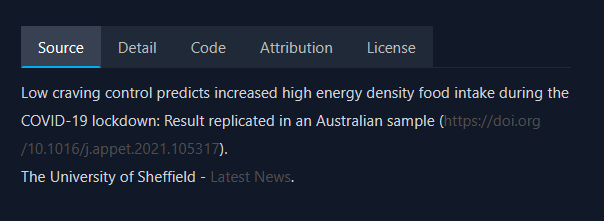
title: "Source",
content: `Low craving control predicts increased high energy density food intake during the COVID-19 lockdown: Result replicated in an Australian sample (<a href="https://doi.org/10.1016/j.appet.2021.105317">https://doi.org/10.1016/j.appet.2021.105317</a>). <br/> The University of Sheffield - <a href="https://www.sheffield.ac.uk/news/more-half-brits-snacked-more-lockdown">Latest News</a>.`
},
{
title: "Detail",
content: `The <a href="https://nivo.rocks/marimekko/">marimekko</a> component (similar to a bar chart) is used for this visualisation for extra dimensions.`
},
{
title: "Code",
content: `This visualisation is created using React.`
},
{
title: "Attribution",
content: `Images used here such as flags and snack were downloaded from <a href="https://uxwing.com/">uxwing.com</a>.`
},
{
title: "License",
content: `This is covered by a Creative Commons license (<a href="https://creativecommons.org/licenses/by-sa/4.0/">CC BY-SA 4.0</a>).`
}
];The data array starts with export const then followed by the array name dataArray. There are five objects in the data array corresponding to five tabs. Each object has two properties and is wrapped by a pair of curly brackets. title is the tab name, and content is the text visitors will see under the tab name. You can write html in the content but note that it must be one line only - use <br/> for line break instead of press enter.
Once you have prepared the data, pass the data array to the Tab component:
export const dataArray = [ ... ]

<VisDiv>
  <Tab data="{dataArray}" />
</VisDiv>
Once you are happy with your visualisation page, create a pull reqeuest to merge your commits!
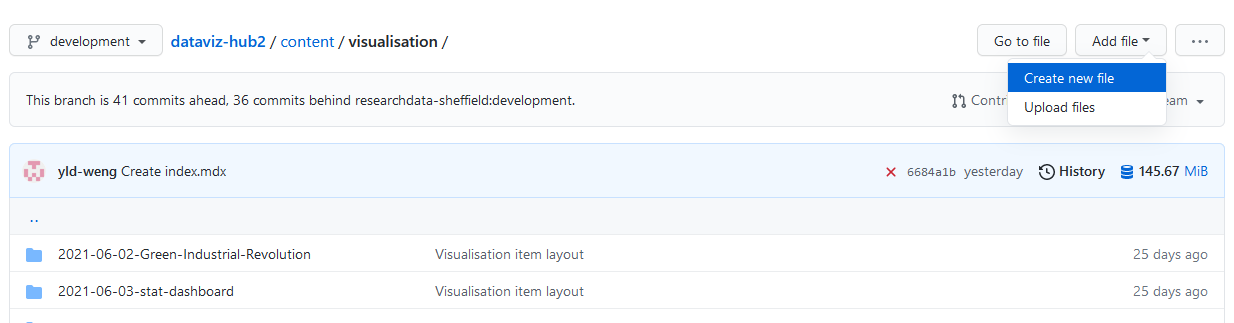
If you haven't set up a local development environment, go ahead to the GitHub repository and click the Fork button on the top right of the page. Then go to the forked repository by click your profile icon on the top right and click Your repositories. Go to the repository and continue to navigate to content/visualisation. Since we cannot create a folder without a new file, click the Create new file button as shown in the image below:
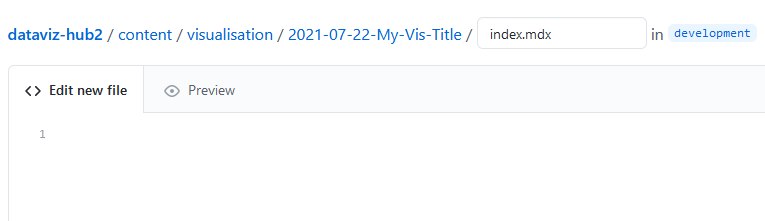
Copy the name of the folder you have created in previous steps into the box with the placeholder Name your file..., followed by a slash and index.mdx. Then copy all the text in your local index.mdx to the editor below.
Once that's done, scroll to the bottom of the page and click commit new file. The webpage will then bring you to the new folder and you can now upload all other files in your local machine.
If all goes well, go to the repository's main page (by click Code on the top left) and open a pull request.
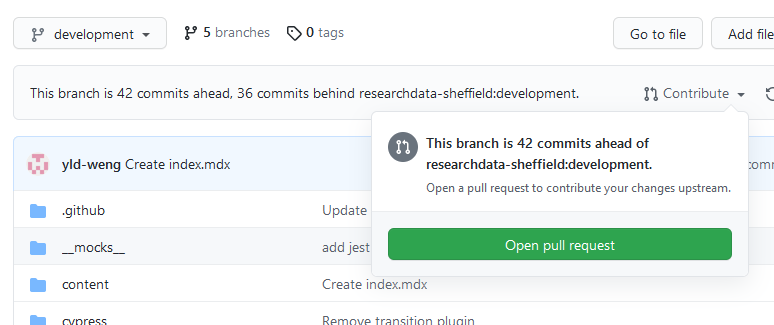
Make sure the base repository is researchdata-sheffield/dataviz-hub2/development and the head repository will be the branch you are working on.
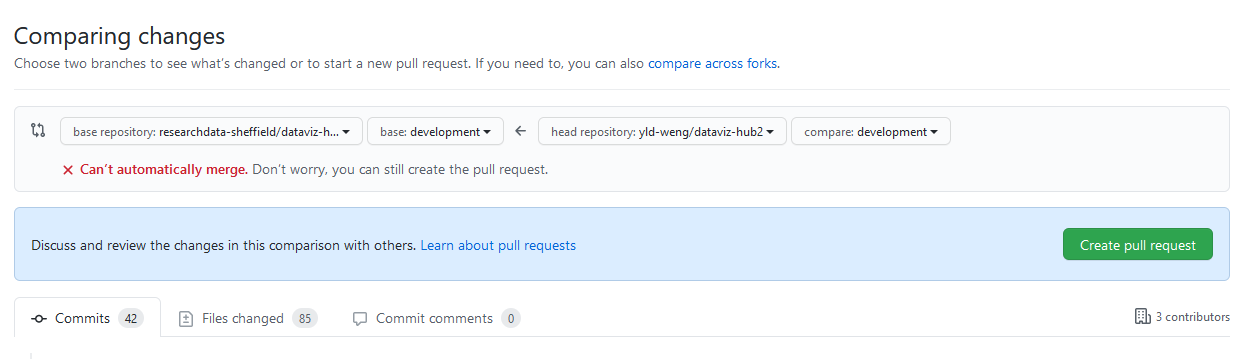
After you have created a pull request, we will review your submission and make it live!