


With the Shiny package you can build interactive web applications using R script. This tutorial will give you quick-start guide to help you begin to explore the versatile package and create your own applications as well as present some ready to use templates to help you to build your first Shiny app.
With the Shiny package installed you can start to develop your app. The basic components of a shiny app are ui commands and server commands. The ui commands make up the user facing part of the app, this is where users can declare inputs; common inputs are listed in this helpful widget gallery. The server commands are where the bulk of your processing will take place. These two components can be created in a single app.r file as shown below:
library(shiny)

ui <- fluidPage(
  <UI Commands>
)

server <- function(input, output) {
  <Server Commands>
}

shinyApp(ui = ui, server = server)
However, these files can become lengthy and difficult to read, particularly for complex applications.
Therefore it is common practice to separate the ui and server components into separate files, stored together in a new directory.
Each component named ui.R and server.R respectively.
The following code is an example of a simple shiny app which creates a sine wave with time equal to the user input.
In this example the ui file is built in a fluid page format, containing a numeric input widget and a plot output.
The numeric input widget allows users to specify the sample size. This value is referred to as input\$\<id\>.
The plot output is refered to as output\$\<id\> and is called from the server.r file.
ui <- fluidPage(
  numericInput(inputId = "Num",
               "Sample size", value = 15),
  plotOutput(outputId = "LinePlot")
)
The server.r file contains instructions on how to build the output objects called in the ui. Inputs from the ui file are called by name as specifed in the ui file, in this case, input$Num. renderPlot({}) specifies the code required to create the LinePlot object, which is called into the ui.r file.
server <- function(input, output) {

  output$LinePlot <- renderPlot({
    x=seq(0, input$Num, 0.1)
    y=sin(x)
    df <- data.frame(x, y)

    ggplot(data = df, aes(x, y)) +
      geom_line() +
      labs(x = "Time", y = "Sine Wave")
  })
 }
This Shiny app also uses a global.R file, stored in the same directory as the server.R and ui.R files.
This file defines objects that are available to both sides of the application.
Global.R files are executed only once as the app compiles. In this instance it contains the command to load relevant packages
library("tidyverse")
If you are new to Shiny then these official tutorials will be really helpful to get you started. We also encourage you to get inspiration from the Shiny Gallery which consist of many wonderful Shiny apps created within the Shiny app developer community. All apps in the Shiny Gallery are open source and you are most welcomed to learn from others! Some other useful resources:
If you are looking for something more advanced, check out the golem framework for building Shiny apps.
When creating a Shiny app, we recommend you to consider the following steps (preferably in the order shown below):
One of the most important aspects for reproducible research is to make sure data is preserved and accessible so that it can be pulled out anytime regardless of the tools people are using. Researchers are strongly encouraged to deposit their data in ORDA(university's data repository), unless there is a subject-specific repository or data centre which is commonly used in their field.
It is quick and easy to read data in R, here is an example of reading a csv file:
myData <- read.csv("https://figshare.shef.ac.uk/ndownloader/files/25647497")
# OR using readr
library(readr)
myData <- read_csv("https://figshare.shef.ac.uk/ndownloader/files/25647497")
To get the url for a dataset in ORDA, follow the steps below:
- Click on item containing the dataset and it will navigate you to figshare.shef.ac.uk
- Hover on the dataset you wish to use and right click the download text that shows up
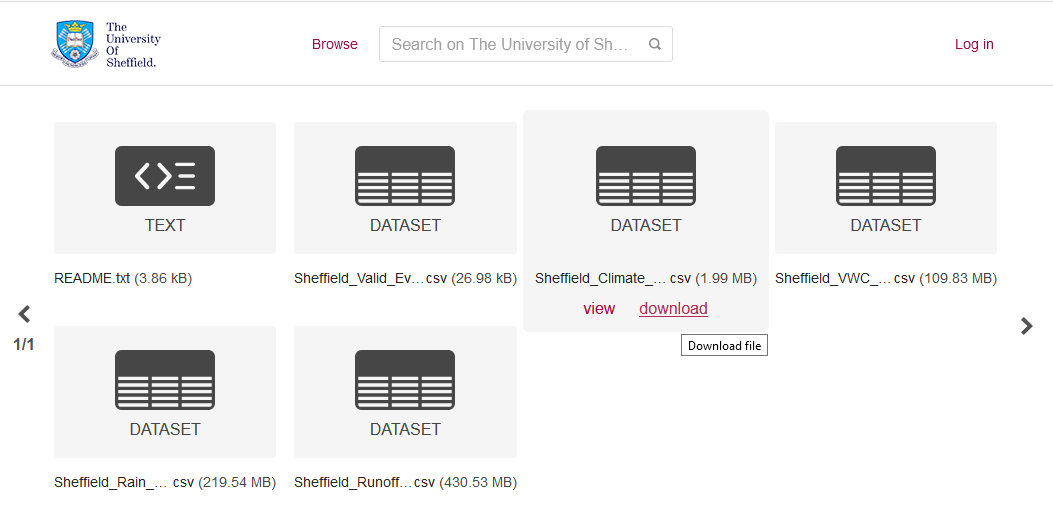
- Click
Copy Link Location(Firefox) /Copy link address(Chrome) /Copy link(Edge and Safari)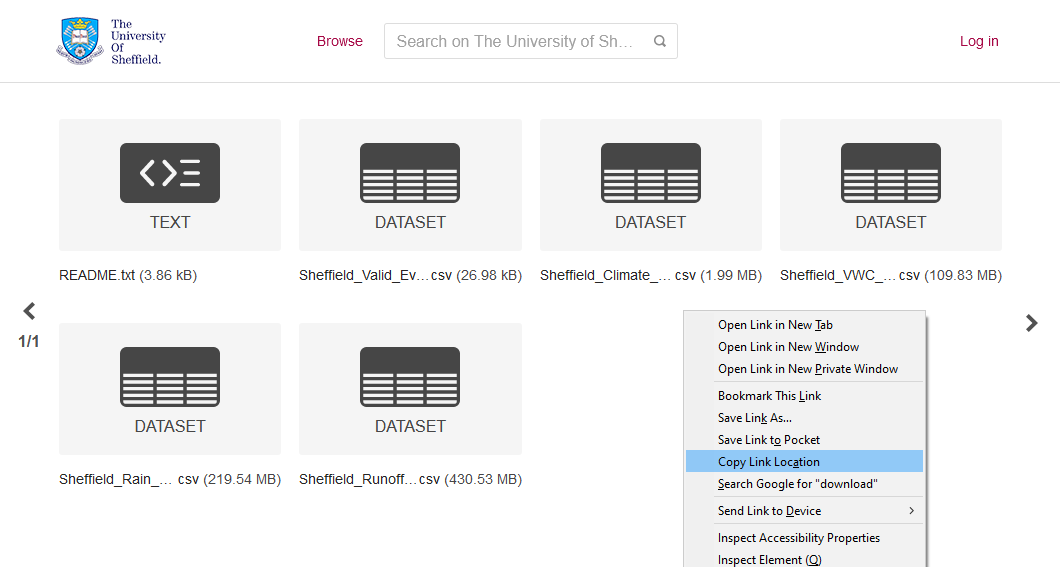
Each template will be executable as is if the data file has been placed in the correct directory. The app.R file contains a line source('./climateData.R') which read and parse the climateData.R script (which does some data processing) from the root directory (change the path accordingly if you placed the file in a different directory), all codes within this script will be executed and any variables or functions defined within this script can also be used in the app.R file.
To use any particular template, either download the whole repository OR download both the corresponding folder use the link provided in each section and/or the climateData.R file if required. You can also download and mix multiple templates together.
It is always advisable to create a seperate script for data processing and other housekeeping tasks then use the source() function to include data when necessary. This will increase your code readability and easier to maintain. To add your own data you can replace all contents within the data file with any steps for preparing data for visualisations.
When replacing a widget we recommend you verify the output of the widget in the server function like output$widgetOutput = renderText({ input$yourWidgetId }) and then print the output in the main panel using verbatimTextOutput("widgetOutput"). These steps will help you pass the correct values to charting functions. Each visualisation package has different render and output functions, for example Plotly has renderPlotly() and plotlyOutput() whereas Highcharter uses renderHighchart() and highchartOutput().
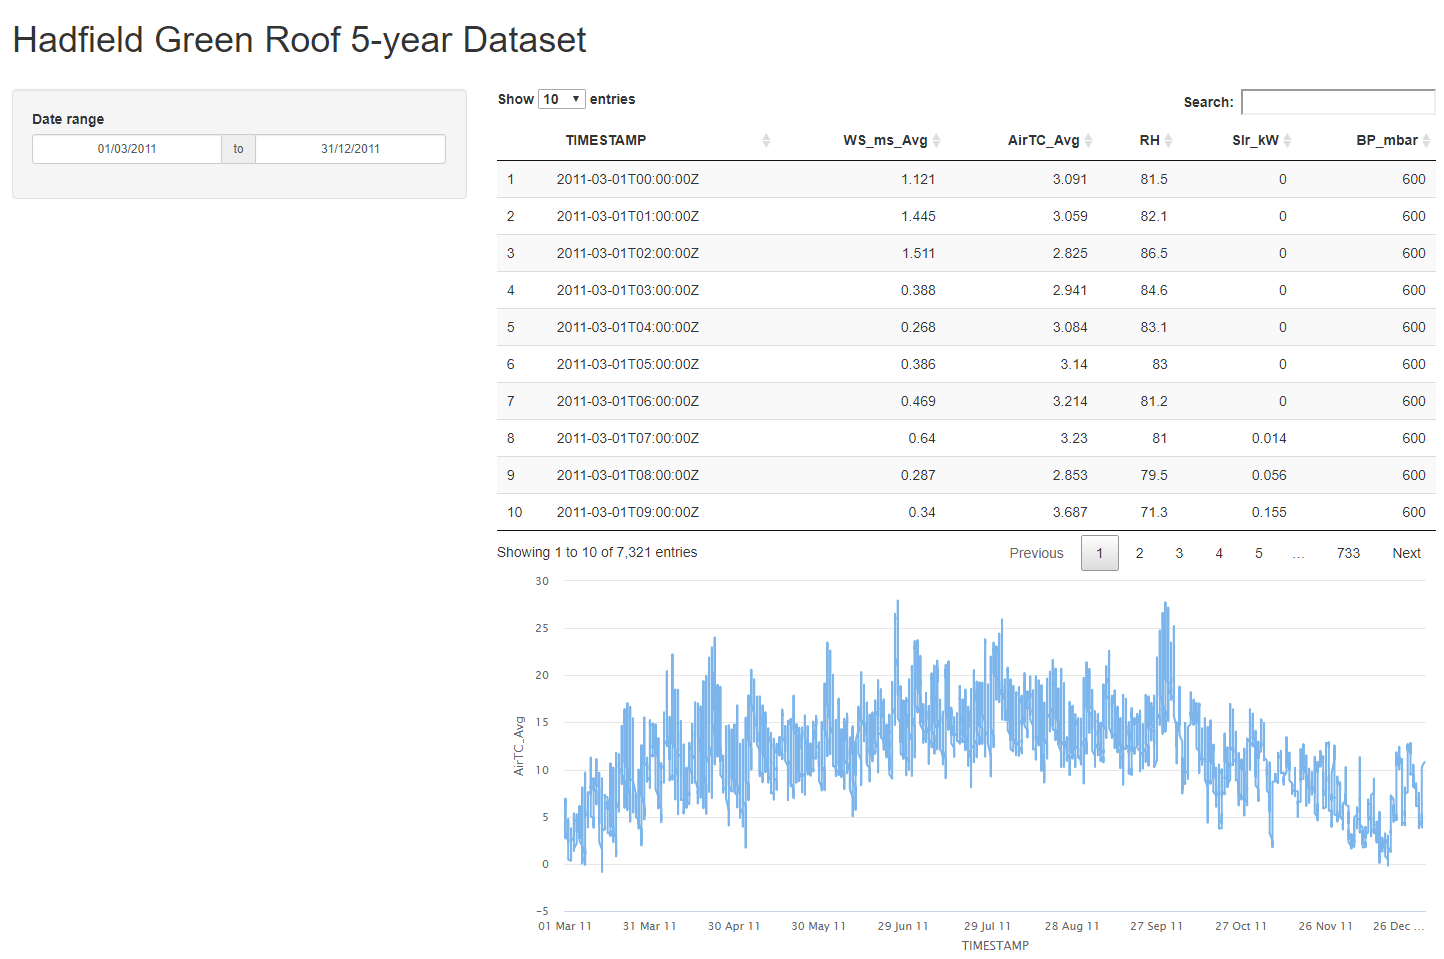
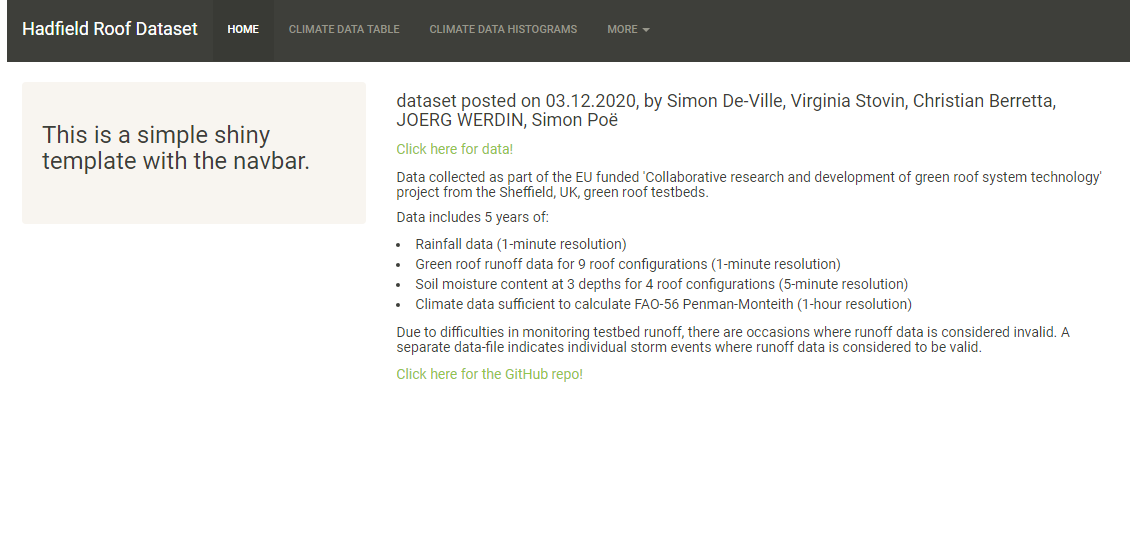
This simple template uses the DT package to display data in a table and the Highcharter package for creating time series. Additionally there is a date widget that controls the date interval for visualisations on the right.
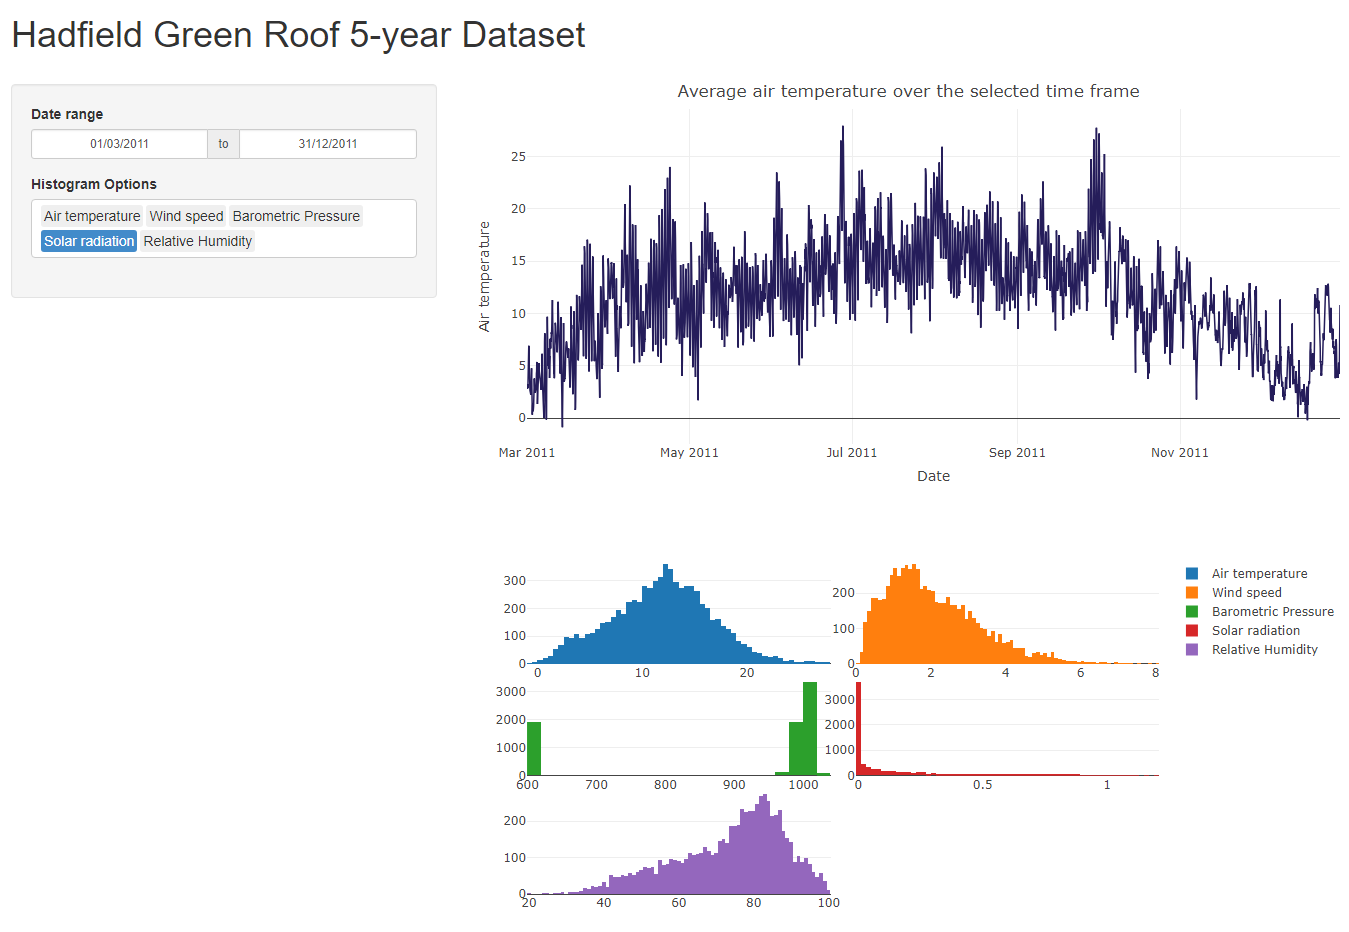
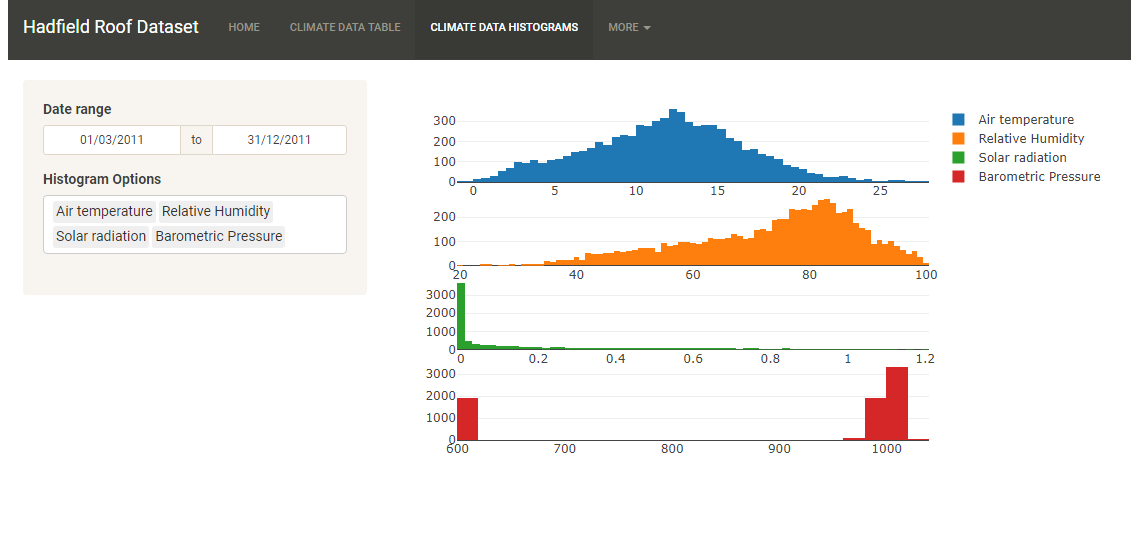
This template builds on top of the previous one and replaced Highcharter with Plotly and added histograms as well as an options widget for choosing variables to plot.
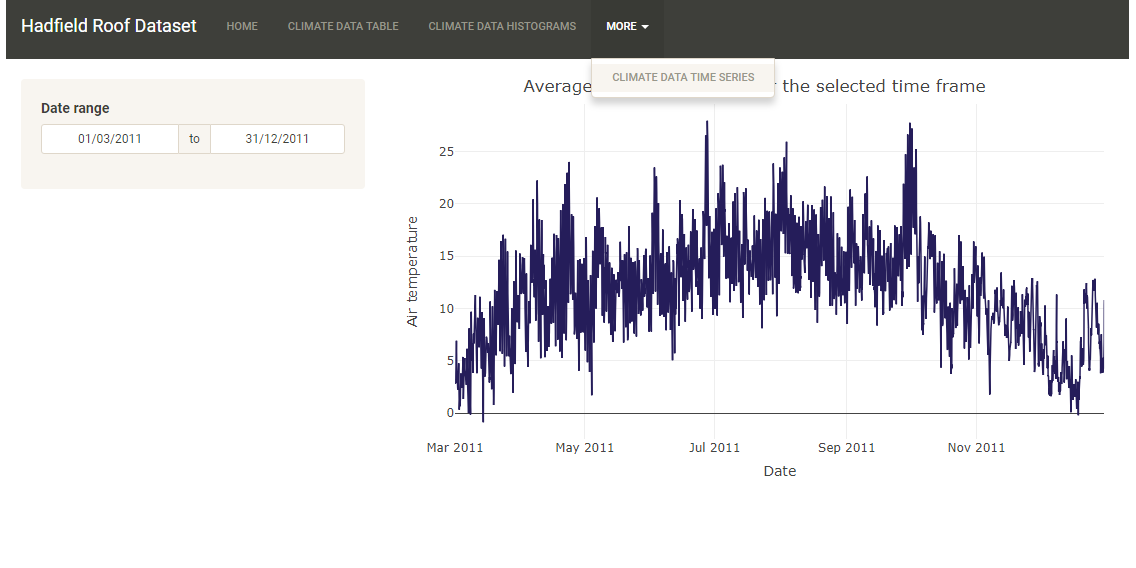
Scrolling through a long page is not a nice experience for users and this process is repeated whenever you want to change parameters using widgets that are on the top of the page, therefore, splitting contents and charts into different pages/tabs could be a good option. This template uses the sandstone shinytheme, you can always change or remove it at line 16.
This scattergeo plot was made using Plotly shows the itinerary of King Edward I within the selected date range. If you have geographical data that you want to plot, this template might be a good place to start.
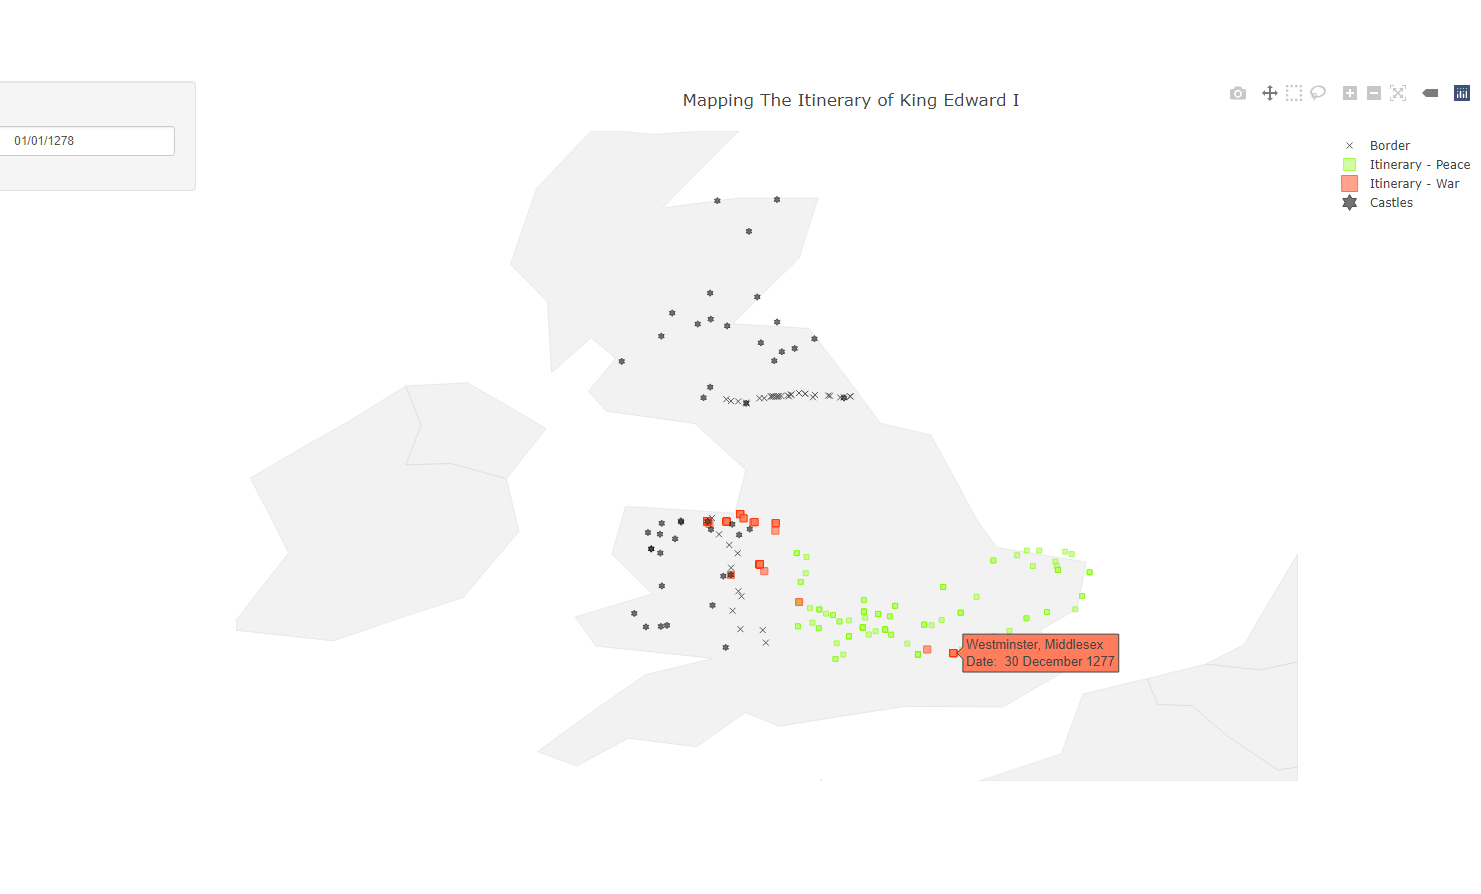
This template extends the previous scattergeo plot and added a slider that allows users to view the itinerary at specific date (including previous dates). Once the play button is clicked the slider will automatically increments day by day until it hits the end date, and the map will also be updated accordingly.
Please read this public guidance/policy statement for hosting shiny apps.