
Interactive Notebook with Jupyter Widgets

Yu Liang Weng
16 June 2020 · 6 min read
"Widgets are eventful python objects that have a representation in the browser, often as a control like a slider, textbox, etc. You can use widgets to build interactive GUIs for your notebooks. You can also use widgets to synchronize stateful and stateless information between Python and JavaScript." - Jupyter widgets
This documentation follows from 'Plots with Python' and assumes some prior knowledge of Python. If you need assistance with Python, python.org provides documentation and tutorials. While this post introduces some basic elements of ipywidgets, you should also rely on the latest documentations on here.
To follow this tutorial, it is best to use JupyterLab (2.0 or above). If you have time, read Plot with Python (you'll find codes are coming from this post). Make sure the following packages are installed:
- Numpy
- Pandas
- seaborn
- Jupyter Widgets
- You'll need to run
jupyter labextension install @jupyter-widgets/jupyterlab-manager@2.0for JupyterLab (v2.0 or above)
In addition, datasets we're going to use are Road Safety Data for accidents between 2016-2018 [1] [2] [3] (licensed under Open Government Licence).
First thing first, import all necessary packages in addtion to those in this post:
from __future__ import print_function
from ipywidgets import interact, interactive, fixed, interact_manual, Layout
import ipywidgets as widgets
To create a widget, use the format widgets.widgetName, you can find all available widgets here. Here I'm using two DatePicker, and you only need to specify one property - description of your widget to get things working. If you don't assign the widget to a variable then it will display automatically, however, if you wish to customise the layout then assign it to a variable and use whatever is available here. widgets.HBox on the last line represents a horizontal box.
import datetime

start_date = widgets.DatePicker(
    description='Start Date',
    disabled=False
)
end_date = widgets.DatePicker(
    description='End Date',
    disabled=False
)

widgets.HBox([start_date, end_date])
Alternatively, use display(...) from IPython.display.
from IPython.display import display
display(start_date, end_date)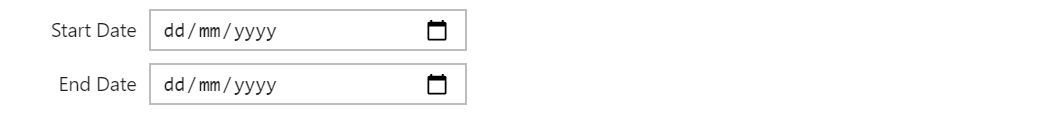
To close a widget, use it's calling method start_date.close().
To link two widgets together so that when one of widget's value changed the other widget will change to
the same value, use something like:
linkDate = widgets.jslink((start_date, 'value'), (end_date, 'value'))If you want to unlink, call unlink() method on the link.
After we have created widgets, how do we make it to interact with other components? ipywidgets provides several functions that creates user interface controls for interactive actions:
- interact - basic level function, generates and display UI for you
- interactive - different to interact, returns a widget instance rather than display it
- interact_manual - provides restriction on execution so updates will not be trigger until permission granted by you
- interactive_output - more flexibility in addition to interact, allows you to control layout of widgets
This post will only includes contents on interactive_output, if you're interested in other functions, visit
the online documentation.
Let's start with an example.
def f(start, end):
    print('start date: {}, end date: {}'.format(start, end))

out = widgets.interactive_output(f, {'start': start_date, 'end': end_date})

widgets.HBox([widgets.VBox([start_date, end_date]), out])
For all interact functions, you're required to provide a custom function for the first parameter, and specify
widgets as inputs for your custom function. In here I defined a function called f that takes two arguments
start and end, then return a message with their values onto the screen. Then in the interactive_output function
we pass the f function and two widgets (start_date and end_date) defined earlier. Note that in the f function
start and end are values of two widgets rather than widget instances, that's why you can use it without calling
start.value.

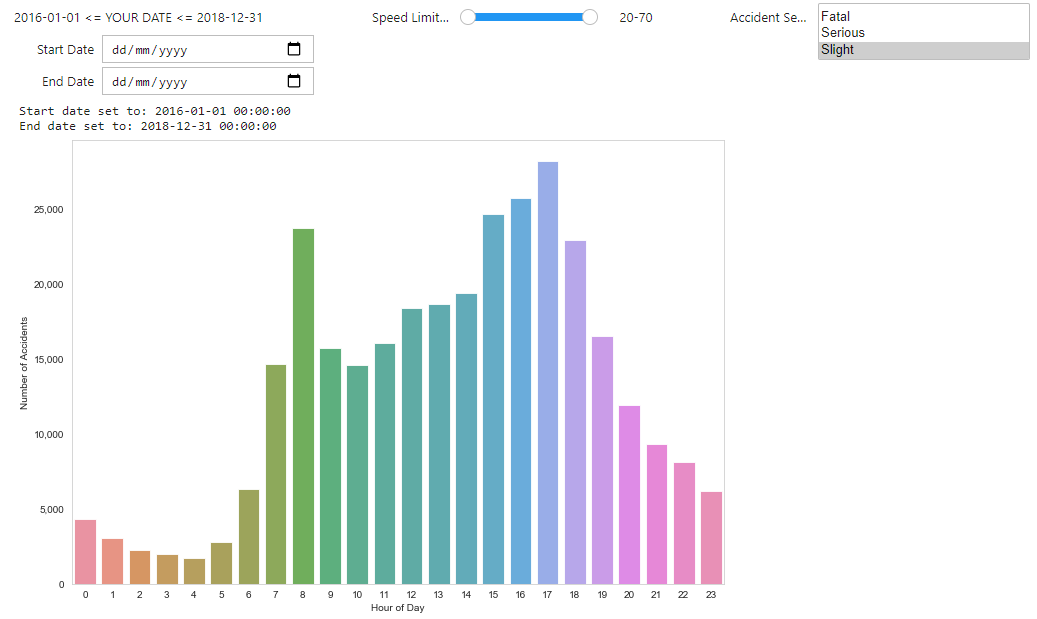
By following the same pattern, we can add as many widgets we want then define a function to handle values return by widgets and output whatever you need. Suppose we want to update the graph illustrates distribution of number of accidents for each hour through widgets that controls date, speed limit and accident severity. Here's our layout (it won't run without the change_parameters function):
out = widgets.interactive_output(
        change_parameters,
          {'start': start_date,
           'end': end_date,
           'speed_limit': speed_limit_widget,
           'accident_sev': accident_sev_widget
          }
      )
ui = widgets.HBox(
        [widgets.VBox(
          [widgets.Label("2016-01-01 <= YOUR DATE <= 2018-12-31"), start_date, end_date]),
          speed_limit_widget,
          accident_sev_widget
        ],
        layout=Layout(display='flex', flex_flow='row wrap', justify_content='space-between')
    )
display(ui, out)
Before we define the function, we should create widgets for accident severity and speed limit:
accident_sev_widget = widgets.SelectMultiple(
    options=['Fatal', 'Serious', 'Slight'],
    value=['Fatal', 'Serious', 'Slight'],
    description='Accident Severity',
    disabled=False,
    rows=3
)

options = [20, 30, 40, 50, 60, 70]
speed_limit_widget = widgets.SelectionRangeSlider(
    options=options,
    index=(0, 5),
    description='Speed Limits (mph)',
    disabled=False,
    style={'background-color': '#000'}
)
Now let's define the change_parameters function, we can copy and paste the code for creating the graph:
def change_parameters(start, end, speed_limit, accident_sev):

  acc_by_time = df_acc.Time.value_counts()  acc_by_hour = acc_by_time.groupby(acc_by_time.index.hour).sum()
  sns.barplot(acc_by_hour.index, acc_by_hour.values, alpha=0.86, palette="husl") \
      .get_yaxis().set_major_formatter(matplotlib.ticker.FuncFormatter(lambda x, p: format(int(x), ',')))
  plt.xlabel("Hour of Day")
  plt.ylabel("Number of Accidents")
However, the graph is created using the original dataset df_acc, before update the graph we need to filter the dataset according to
values from widgets. We can do so by insert some codes before the highlighted line.
Starting with the Date, since the date widget doesn't have restriction on min (minimum) or max (maximum) date range, we shall do
this manually. At the beginning, two dates are defined so that the graph is still produced while dates remain unselected. Next thing
is to check whether selected dates are within the range (2016-2018), I've written a check_date function to do this. Lastly, we use these
dates to filter the dataset (line 13).
def change_parameters(start, end, speed_limit, accident_sev):
    start_date = pd.to_datetime('2016-01-01')
    end_date = pd.to_datetime('2018-12-31')

    if check_date(start):
      start_date = pd.to_datetime(start)
    if check_date(end):
      end_date = pd.to_datetime(end)

    print("Start date set to: " + str(start_date))
    print("End date set to: " + str(end_date)

    df_update = df_acc.loc[(start_date <= df_acc['Date'].dt.date) & (end_date >= df_acc['Date'].dt.date)]
    #### other things here #####

def check_date(my_date):
    if my_date is None:
        return False
    start_date = pd.to_datetime('2016-01-01')
    end_date = pd.to_datetime('2018-12-31')
    my_date = pd.to_datetime(my_date)
    return ((my_date >= start_date) & (my_date <= end_date))
Codes for speed limit and accident severity are much more straightforward.
low = speed_limit[0]high = speed_limit[1]
df_update = df_update[df_update.Speed_limit.between(low,high)]
df_update['Accident_Severity'] = df_update['Accident_Severity'].map({1: 'Fatal', 2: 'Serious', 3: 'Slight'})df_update = df_update[df_update['Accident_Severity'].isin(accident_sev)]
Since the SelectionRangeSlider widgets takes two values you'll get them as a tuple in the function, in line 1-2 they are assigned to variables. Line 5 make sure values of the accident severity column in the original dataset are the same as in the widget.
And we get the following:
Full codes is available here. The content of this post only covers a small area of Jupyter widget's capability, I'll suggest you reading the following documentations:
- Jupyter widget events
- bqplot - plotting library
- ipyleaflet - interactive maps
- ipyvolume - 3d plotting library
- gmaps - interactive google maps
- Asynchronous Widgets